
Why in News: India’s Finance Ministry recently declared the economy to be in a “Goldilocks situation” with moderate growth, low inflation, and stable monetary conditions.
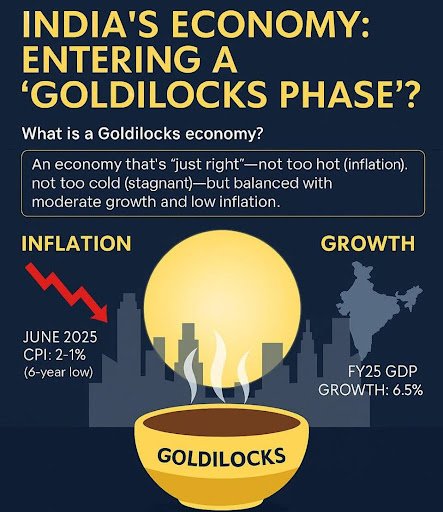
India’s Goldilocks Situation
Moderate Economic Growth
- India’s GDP growth rate is strong and stable, recorded at 7.6% in recent quarters.
- India exited FY2024 as a $3.6 trillion economy, reflecting a buoyant macroeconomic backdrop.
Subdued Inflation
- Consumer Price Index (CPI) inflation has decelerated steadily, falling from 4.8% in May 2024 to 2.82% by May 2025.
- Inflation levels are within the Reserve Bank of India’s (RBI) comfort zone, indicating price stability.
Supportive Monetary Conditions
- Interest rates have peaked and stabilized, reflecting an accommodative monetary policy environment.
- The monetary environment supports investment and consumption without overheating the economy.
Macro Stability Indicators
- Fiscal deficit and revenue deficit are on a declining trend, signaling fiscal consolidation efforts.
Positive Market and Corporate Sentiment
- Corporate earnings have remained stable despite global economic challenges.
- Financial markets reflect confidence in India’s macroeconomic management.
However, this optimistic view masks deeper structural imbalances.
Problems in the “Goldilocks” Situation of Indian Economy
1. Inflation and Price Volatility
Food inflation remains high and volatile:
- Consumer Food Price Index (CFPI) peaked at 10.87% in Oct 2024, much higher than general inflation.
- Food constitutes nearly half of household consumption, especially for low-income groups.
- Volatile food prices reduce purchasing power and create budgeting uncertainty.
- High food inflation forces families to compromise nutrition, take loans, or cut essential expenses.
2. Stagnant Real Wage Growth
- Despite nominal salary hikes (~9.2% in 2023), real wage growth is low (~2.5%) or negative in some years.
- Inflation erodes nearly half of nominal wage gains, reducing actual buying power.
- Workers especially in IT services, manufacturing, and engineering face limited wage growth, leading to financial stress.
3. Income Inequality
Despite GDP growth, wealth gains are unevenly distributed:
- Gini coefficient shows only modest improvement, with significant inequality remaining.
- Formal taxable income data misses informal sector realities where many poor workers exist.
- India exhibits a K-shaped recovery: affluent and certain sectors thrive, but large segments lag.
- Rising billionaires contrast with stagnant real incomes for many, risking social cohesion and inclusive growth.
4. Fiscal Challenges and Debt Burden
- Although fiscal deficit is projected to decline (from 6.4% to 4.4%), absolute deficit levels remain high.
- High government borrowing risks crowding out private investment by raising interest rates.
- Public debt-to-GDP ratio (~81%) is well above government targets (60%), increasing future debt servicing costs.
- Fiscal constraints limit spending on critical sectors like healthcare, education, and infrastructure, or may lead to higher taxes.
5. Structural Imbalances Hidden by Macro Numbers
- Macro indicators like GDP and headline inflation mask the underlying economic fragilities.
- Many households and workers do not experience the “sweet spot” due to inflation pressures and wage stagnation.
- Unequal growth limits broad-based demand and economic sustainability.
Conclusion: Towards Inclusive and Sustainable Growth
True economic equilibrium means improving real incomes and fiscal resilience.India’s sustainable future lies in addressing wage stagnation, income inequality, and fiscal challenges.
UPSC Mains Relevance
1. GS Paper 3 (Economy):
- Understanding of India’s macroeconomic conditions
Mains Practice Question
Q. Discuss the implications of India’s “Goldilocks” economic situation. Do you think the term accurately reflects the ground realities faced by the majority of Indians?
Prelims Fact
K-Shaped Recovery
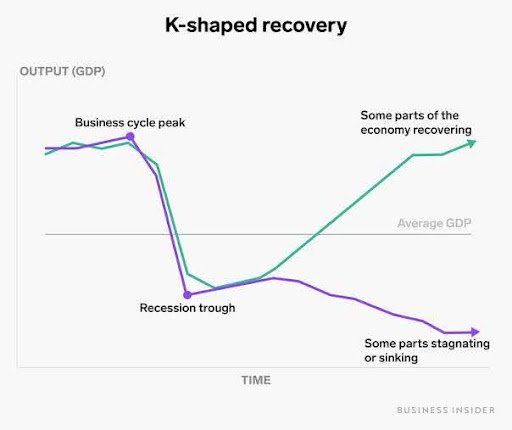
Definition:
- A K-shaped recovery occurs after a recession when different sectors or groups in the economy recover at different rates or magnitudes.
Key Features:
The economy splits into two divergent paths:
- Upper arm of K: Sectors/groups that recover quickly and grow.
- Lower arm of K: Sectors/groups that recover slowly or continue to decline.
Why called K-Shaped?
- When plotted on a graph, the recovery paths of different sectors resemble the two arms of the Roman letter “K,” diverging sharply.
Significance:
- Highlights uneven recovery and the need for targeted policy interventions to support lagging sectors or vulnerable populations