Brief Overview
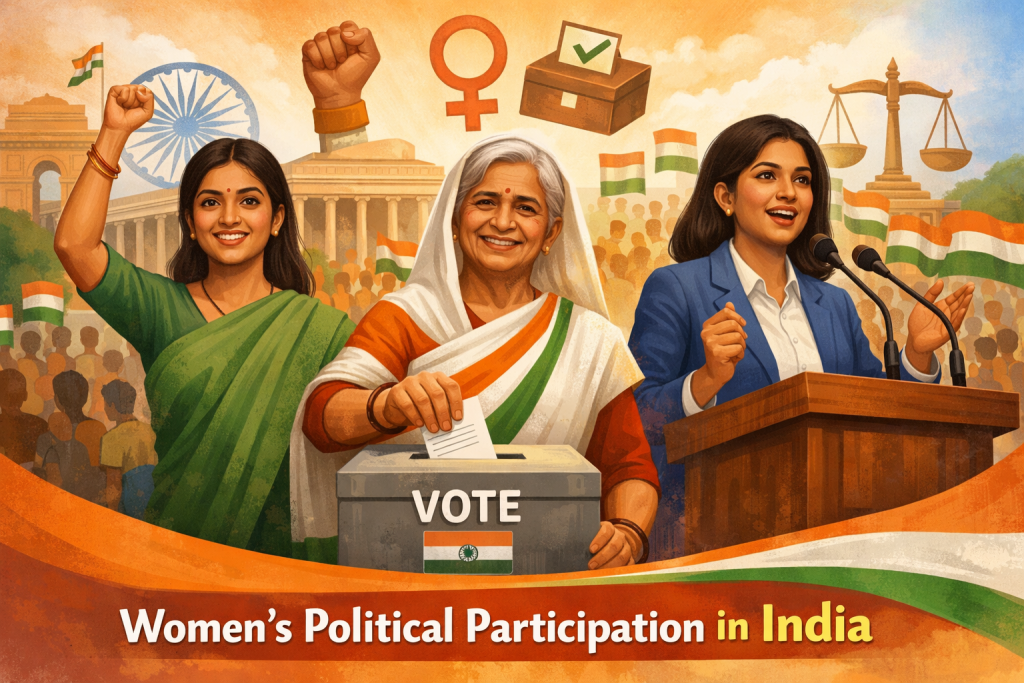
- Women’s engagement with electoral politics in India has expanded significantly over the past six decades, particularly in voter participation.
- Women now vote in numbers nearly equal to men, and in several State Assembly elections they even outnumber male voters.
- Despite this progress, women remain underrepresented in legislatures and political decision-making.
- The situation reflects a paradox: strong electoral participation but limited political representation and authority.
Data Regarding Women Political Participation
- Voter participation
- In the 1967 Lok Sabha election, male turnout was 66.7% while female turnout was 55.5%, creating a gap of 11.2 percentage points.
- The gap widened slightly to 11.8 percentage points in 1971.
- From the 1980s onward, this difference gradually declined.
- By 2009, the turnout gap reduced to 4.4 percentage points.
- In 2014, the gap fell to 1.5 percentage points, and by 2019 and 2024, turnout rates of men and women were almost identical.
- State Assembly elections
- In the early 1990s, women’s turnout was 4 to 5 percentage points lower than men’s.
- By 2005–07, the gap narrowed to –1.8 percentage points, and by 2008–10 it reached –1 percentage point.
- After 2011, women began voting slightly more than men, with the turnout advantage reaching 2.82 percentage points during 2015–16.
- Between 2020–25, women maintained a positive turnout gap of 1.6 percentage points.
- Campaign participation
- Women’s participation in election rallies increased from 9% in 2009 to about 16% in recent elections.
- In activities such as processions and door-to-door canvassing, participation rose from 5–6% to about 11%.
- However, men’s participation in these activities remains roughly double that of women.
- Representation in Parliament
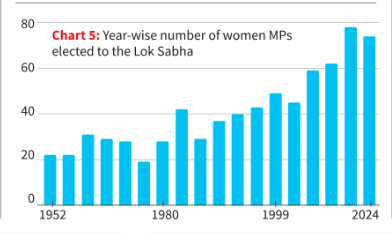
- In the first Lok Sabha (1952), only 22 women MPs were elected.
- Representation rose gradually to 59 women MPs in 2009, 62 in 2014, and a record 78 in 2019, before declining to 74 in 2024.
- Even at its highest level, women constituted only around 14% of the Lok Sabha, far below their share in the electorate.
- Candidature trends
- Only 45 women contested elections in 1957, which increased to 599 candidates by 1996.
- The number rose further to 668 in 2014, 726 in 2019, and 800 in 2024.
- Despite this growth, women remain a minority among total candidates.
- Success rates
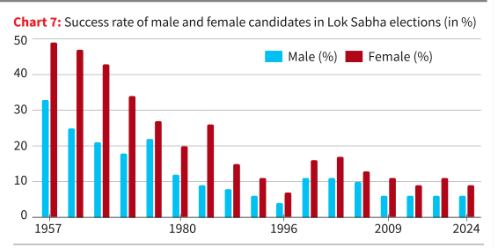
- Historical data show women candidates often perform well when given tickets.
- In 1957, women had a 49% success rate, compared with 33% for men.
- In 1962, women’s success rate was 47%, while men’s was 25%.
- In 2019, 11% of women candidates won, compared with 6% of men.
- In 2024, success rates were 9% for women and 6% for men.
Challenges Faced by Women
- Limited political representation
- Despite high voter turnout, women remain underrepresented in legislatures, reflecting limited access to political power.
- Party nomination barriers
- Political parties often nominate fewer women candidates, creating a bottleneck in representation.
- Campaign-level participation gap
- Women remain less visible in rallies, processions, and campaign activities, limiting their political influence.
- Social and familial constraints
- Surveys indicate that many women require family approval for political participation, such as attending meetings or campaigning.
- Restricted political autonomy
- In 2014, about 51% of women reported voting independently, which slightly declined to 50% in 2024.
- A majority (52%) believe it is important to share political views with family members, reflecting social influence over political choices.
- Institutional inequalities
- Many women perceive politics as less accessible to them.
- 58% believe political families have an advantage, and 57% believe wealth improves entry into politics.
- Around 44% believe political parties prefer male candidates.
- Structural and cultural barriers
- Patriarchal norms remain the most cited obstacle (22%).
- Other factors include household responsibilities (13%), lack of confidence or awareness (12%), cultural norms (7%), and financial constraints (6%).
Way Forward
- Strengthen representation mechanisms
- The Women’s Reservation Bill provides a structural pathway to increase women’s representation in legislatures.
- Increase party nominations
- Political parties need to expand women’s candidature and leadership opportunities.
- Promote political socialisation
- Encouraging women’s participation in campaigns and grassroots political activities can strengthen their role in public life.
- Address social barriers
- Reducing constraints related to family norms, mobility, and household responsibilities is essential for meaningful political engagement.
- Expand leadership opportunities
- Greater inclusion of women in decision-making roles within parties and governance structures can translate electoral participation into real political power.
Conclusion
- Women in India have achieved near parity as voters, marking a major democratic achievement. However, the challenge now lies in ensuring that this electoral participation leads to greater representation, autonomy, and influence in political institutions.